Home -> Law Blog Directory -> Bailout Blogs -> Calculated Risk
(866) 635-2689 for Personal Injury or (866) 635-9402 for Criminal Defense
Find a Local Lawyer
Divorce (866) 635-6190
Personal Injury (866) 635-2689
Criminal Defense (866) 635-9402

Bailout
: Calculated RiskHow do you put recession bars on graphs using Excel?
By Anonymous

Something a little different for a Saturday evening. This is a common question, using excel, how do you get from this:
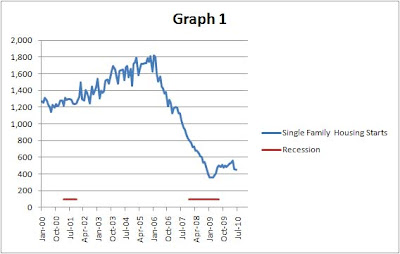

After the jump is a simple step-by-step example on one way to do it:
Graph 1: Start with three columns in the spreadsheet.
Here is a starter excel file (with the following data and first graph).
Set up a data file. For the example below, the first column is months, from January 2000 to January 2011 (no header), the second column uses Single Family Housing Starts from the Census Bureau, excel data here, with the column header "Single Family Housing Starts", and the third column is title "Recession" and is blank excepts for the months in recession. For the months in recession, I entered 100 (recession dates here from the NBER).
Now create a line graph by highlighting the data and clicking on insert and pick the first line graph. The result will look like this:
Graph 2: Put the recession on the 2nd axis. Do this by 1) right clicking on red recession bars, 2) Click on "Format Data Series", and 3) choose "secondary axis".
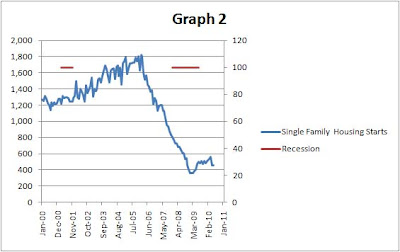
Note: It isn't necessary to put the recession on the 2nd axis and sometimes you will want to put other data there. In that case pick different numbers to mark a recession (like 2,000 instead of 100), so that the eventual columns will fill the entire range.
Graph 3: Change Recession from line to bars.
1) Right click on red again, 2) click on "Change Series Chart Type", 3) choose the first choice under column.
The graph now looks like:

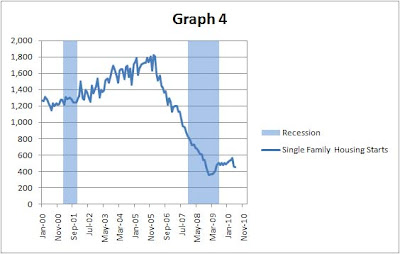
Graph 4: Some cleanup steps.
1) Right click on red, 2) Choose "Format Data Series", 3) Change Gap Width to Zero, 4) Click on "Fill", 5) Pick "Solid fill" and color (light blue in example), 6) Change transparency to 50%.
1) Right click on secondary axis labels, 2) Click on "Format Axis", 3) Change max to 100, 4) Set "axis labels" and "tick marks" to none.
Graph 5: Make it look sharp!
The final look is up to the user, but here is the look I frequently use:
1) Right click on legend, 2) choose "Format legend", 3) position on "top", 4) right click on legend again, 5) increase size and bold.
1) Right click on blue line, 2) click on "Format Data Series", 3) Choose "Line color" and red, 4) Choose "Line Style" and increase width, 5) Choose shadow and use presets "outer".
1) Right click on horizontal axis, 2) click on "add major gridlines"
1) Right click on plot area, 2) select "format plot area", 3) I use "Picture or texture fill" and fill with marble blue at 50% transparency.
At this point I copy and paste the image to Photoshop (or Photoshop Elements) and sometimes make changes - and then save the file as a jpeg to upload to my blog.

Full post as published by Calculated Risk on August 01, 2010 (boomark / email).

#1 Online Legal Resource

On 08-25 at 15:46PM
Acute perpendicular parking #NYPD #NYFD
On 08-18 at 22:18PM
Parallel parking gone bad. Too much gas UES NYC
On 08-18 at 21:41PM
UES NYC
On 08-18 at 21:25PM
Twitter suspends journalist critical of broadcast partner's coverage on dubious grounds @guyadams #nbcfail #twitterfail
On 07-30 at 17:57PM
Model example of 1st Amendment suppression by the People of New York City's Michael Bloomberg #OWS #NYPD
On 07-12 at 21:07PM
AG Holder lackadaisical on Operation in our Sites domain name seizures & RIAA lobbied free speech suppression @dajaz1
On 06-08 at 22:44PM
Why is the Catholic Church going to court over Obama contraception policy? @NewYorker commentary
On 05-31 at 10:08AM
Monks sue Louisiana for right to sell caskets made from forrest destroyed by Katrina
On 05-31 at 07:47AM
Are the abortion ultrasound laws headed for the Supreme Court?
On 05-15 at 21:52PM


Seeking deep throughts in reaction to "The Recession Behind Bars"
Getting the most from Excel 2007 - 3 more
Using Excel to Keep Track of Your Time


 |
|
Contact Us | About Us | Celebrity Law Blog |
Our Partners | Disclaimer
| Law Blog Directory
| Law Jobs
| Law Tweets
| Oil Spill Video
All original material © 1999-2011 by USLaw.com. All other material, including Blog Directory feed content, are © by their respective copyright holders. |